Let’s face it, organizing an event without data is a bit like cooking without tasting. You might get lucky… but you probably won’t nail it consistently.
That’s exactly why event analytics has become a must-have for modern organizers. If you want to improve event performance, boost revenue, and actually understand your audience, your ticket sales data is where the real story lives.
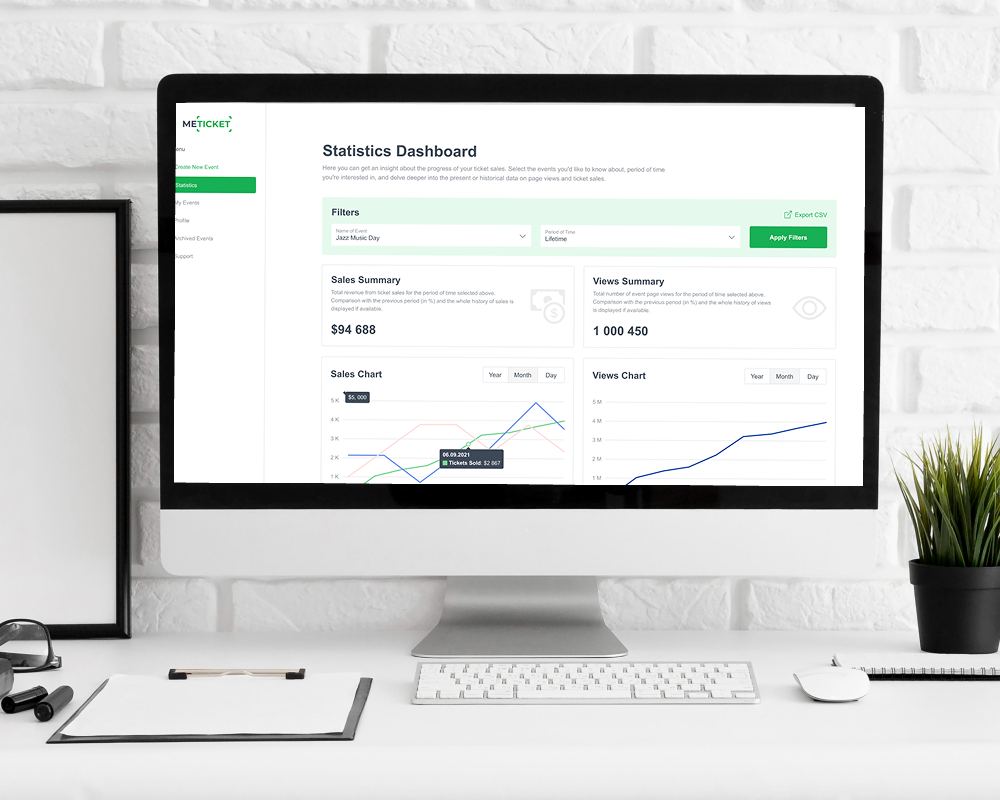
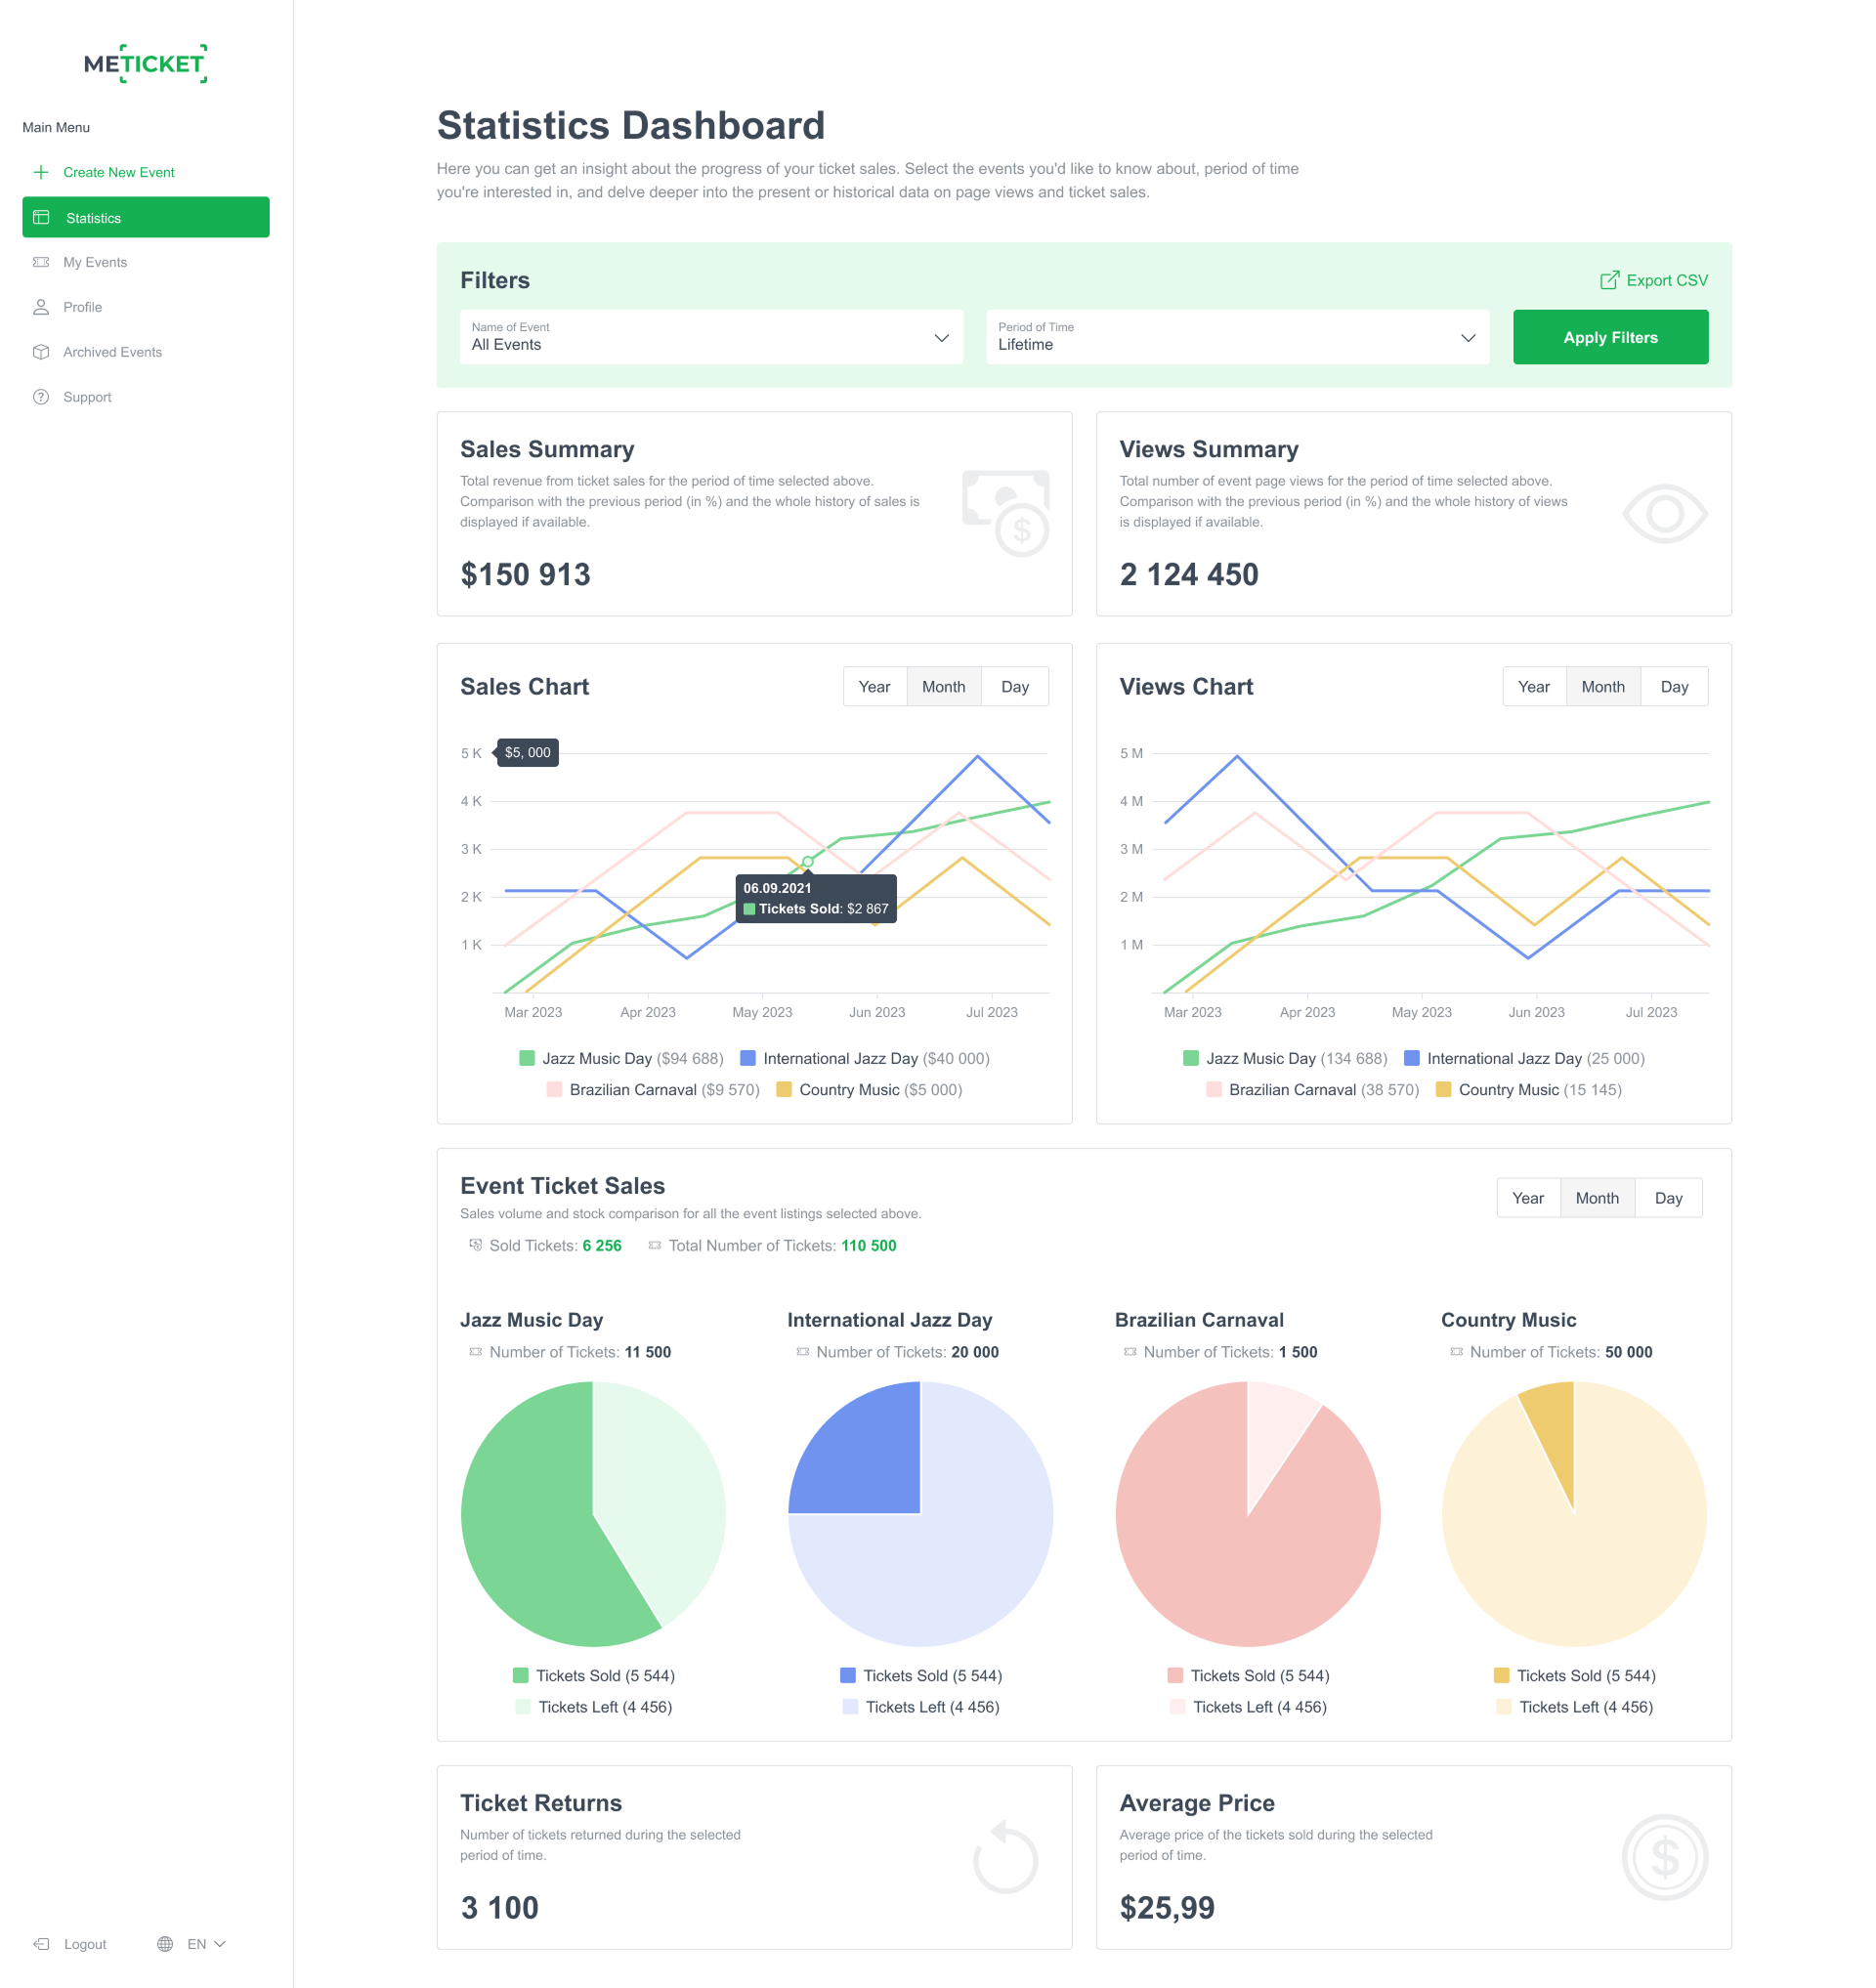
And the best part? You don’t need complicated tools or a data science degree. With platforms like ME-Ticket, everything is already laid out for you in a clean, visual dashboard.
Let’s break it down.
Why Event Analytics Matters More Than Ever
Think of analytics as your event’s personal report card. Every ticket sold, every page view, every refund, it all tells you something important.
Instead of guessing:
- Which event performed best
- Which pricing worked
- When your audience was most active
The Analytics Dashboard inside ME-Ticket turns raw data into clear insights. It’s like having a health monitor for your event, showing what’s thriving and what needs attention.
And honestly, once you start using it, going back to guesswork feels impossible.

Key Event Analytics Metrics You Should Track
Not all numbers are useful. Some just look fancy. So let’s focus on the metrics that actually help you improve event performance.

1. Ticket Sales Summary
This is your big picture.
You’ll see:
- Total revenue
- Sales over time
- Performance across different periods
Spikes in sales? That’s your marketing working. Flat lines? Time to act.
2. Event Views
Views tell you how many people visited your event page.
High views but low sales? That’s a red flag.
It usually means:
- Your messaging isn’t convincing
- Your pricing needs adjustment
- Or your visuals aren’t engaging enough
3. Ticket Type Sales
Not all tickets perform equally, and that’s a good thing.
With detailed breakdowns, you can see:
- Which tiers sell fastest
- Which ones struggle
For example:
- VIP sells out instantly → increase availability
- Early bird underperforms → rethink pricing or timing
4. Ticket Returns (Refunds)
Refunds are often ignored, but they’re incredibly valuable.
They can reveal:
- Scheduling issues
- Poor communication
- Unexpected logistical problems
Fix the cause, and you reduce losses next time.
5. Average Ticket Price
This metric helps you understand your pricing strategy over time.
It shows how:
- Discounts
- Promotions
- Ticket tiers

Quick Overview: What Your Data Is Telling You
Inside the ME-Ticket Analytics Dashboard
Let’s talk about how this actually works in real life.
The dashboard inside ME-Ticket isn’t just numbers, it’s designed to be simple, visual, and actionable.
Real-Time Data Tracking
As soon as someone:
- Buys a ticket
- Visits your page
The data updates in real time, allowing you to immediately track how users interact with your event.
Running ads? You’ll know right away if they’re working.
Interactive Charts & Visualizations
Instead of staring at spreadsheets, you get:
- Sales charts (daily, monthly, yearly trends)
- Views charts (engagement levels)
- Pie charts (ticket distribution)
It’s all visual. Easy to understand. Easy to act on.
Powerful Filters for Deeper Insights
Want to zoom in?
You can filter by:
- Event name
- Time period (last 7 days, last month, custom range)
This means you can compare:
- One event vs another
- This month vs last month
- Seasonal performance
Exportable Reports
Need to share data with your team or sponsors?
You can export everything as a CSV file and use it for:
- Reports
- Presentations
- Strategy planning

Real Example: Turning Data Into Results
Let’s say you hosted a business seminar.
Your analytics show:
- High views but low conversions
- Most traffic came from LinkedIn
- Early bird tickets didn’t sell well
What do you do next?
- Improve your event description and visuals
- Focus more on LinkedIn campaigns
- Rethink your early bird pricing
That’s how event analytics directly helps you improve event performance.
Common Mistakes to Avoid
Even with powerful tools, mistakes happen.
- Ignoring Real-Time Data: If you’re not checking analytics during your campaign, you’re missing opportunities.
- Overlooking Refund Insights: Refunds aren’t just losses, they’re feedback.
- Tracking Too Many Metrics: Keep it simple. Focus on what actually impacts revenue and attendance.
- Not Comparing Events: Your past events are your best teachers. Use them.


Pro Tips for Better Event Results
Want to level up?
- Use urgency (limited tickets, deadlines)
- Test different pricing strategies
- Focus on high-performing traffic sources
- Improve underperforming ticket tiers
- Monitor data daily during campaigns
And most importantly, keep learning from your data.
Conclusion: Turn Data Into Better Events
At the end of the day, great events aren’t just creative, they’re strategic.
By using event analytics, understanding your ticket sales data, and leveraging tools like the ME-Ticket Analytics Dashboard, you can make smarter decisions every step of the way.
No more guessing. No more missed opportunities. Just clear insights, better strategies, and consistently stronger events. Because when you truly understand your data, improving your next event isn’t hard, it’s inevitable.
Frequently Asked Questions about Using Analytics to Improve Your Next Event’s Performance
It helps you evaluate how your pricing strategy impacts revenue and whether discounts or tiers are effective.
You can export your analytics data (e.g., as CSV files) and use it for reports, presentations, or collaborative planning.


